Opening Scene
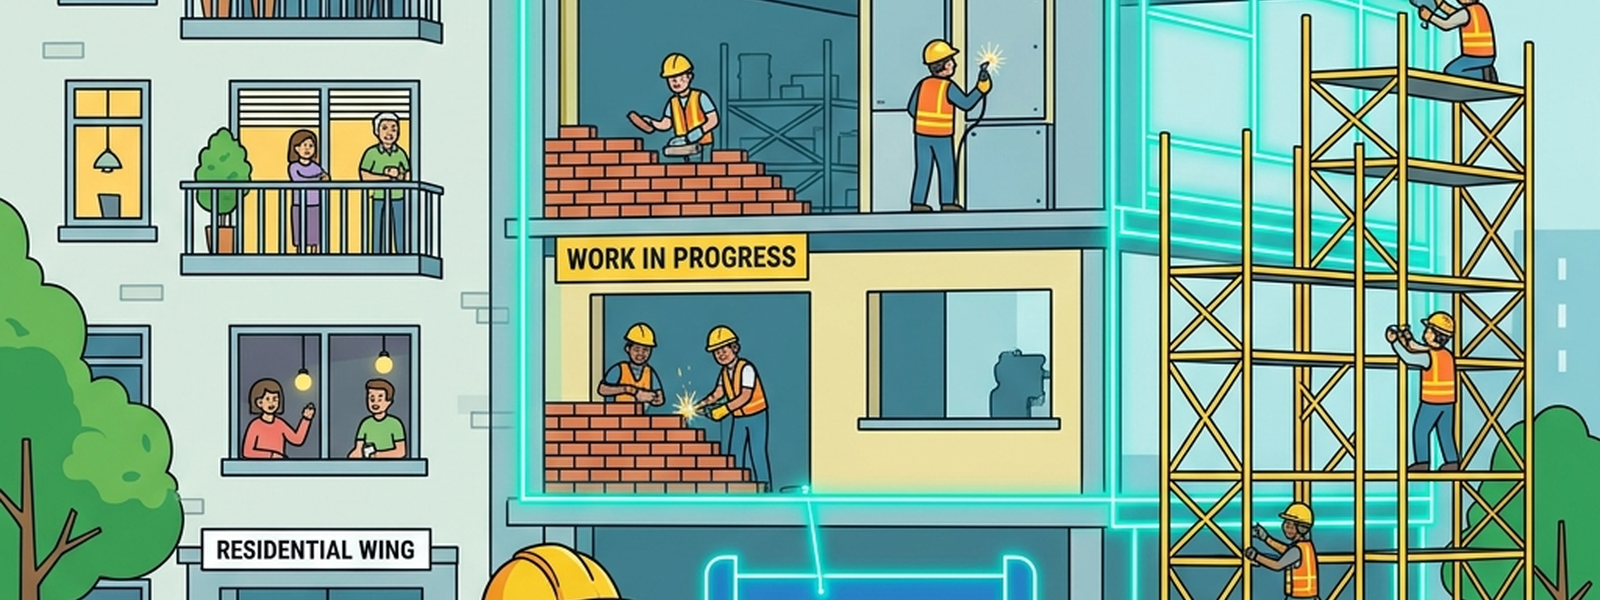
You can’t just knock down a load-bearing wall in a house while a family is still living in it — furniture would need to move, the ceiling might sag, and someone could genuinely get hurt. But you can add a new room, repaint a wall, or swap out a light fixture without anyone needing to move out. The difference is whether the change threatens the structure everyone is currently relying on, or simply adds to it.
Data models face exactly the same dilemma every time they need to change.
In Plain English
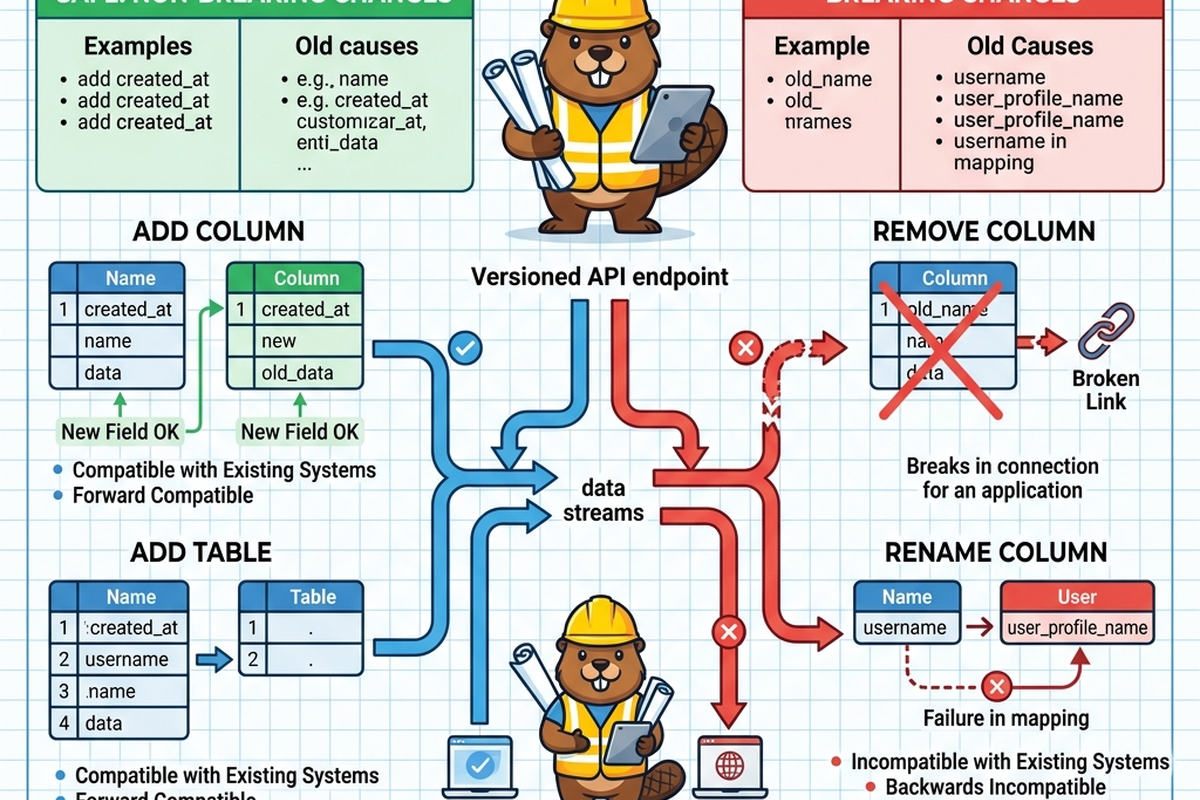
Schema evolution is the process of changing a data model over time — adding new fields, modifying relationships, restructuring tables — while it’s actively being used. Versioning means keeping track of these changes deliberately, so that systems depending on an older structure aren’t broken the moment a new one is introduced. A breaking change is one that removes or alters something existing systems rely on; a non-breaking change simply adds something new without disturbing what’s already there.
The Old Way
Traditionally, changing a live data model was treated with real caution, and for good reason — it was genuinely hard to know everything that depended on a given table or field. A data architect proposing a schema change would often have to manually trace through documentation, ask around different teams, and hope nothing downstream had been built on an undocumented assumption. This uncertainty pushed many teams toward avoidance: rather than fix an awkward but functioning structure, they’d build workarounds around it indefinitely, the data equivalent of just living with a badly placed wall rather than risk moving it.
When changes did happen, they were often handled bluntly — a hard cutover on a single date, with downstream consumers expected to adapt all at once. This worked, but created the kind of disruption a family would feel if a contractor simply removed a wall on a Tuesday morning with no warning.
What’s Changing (and Why AI Is the Reason)
- Seeing through walls is now possible. AI-assisted lineage and impact-analysis tools can trace, automatically, which reports, pipelines, dashboards, and even AI assistants depend on a given table or field — turning “we’re not sure what this might break” into a concrete, reviewable list before any change is made.
- Migration work itself is getting AI assistance. Tools can now help draft the transformation logic needed to move data from an old structure to a new one, and even generate updated downstream queries that adapt automatically to a schema change, reducing the manual rewrite burden that used to make migrations slow and risky.
- Risk assessment is shifting from guesswork to evidence. Rather than relying on a senior architect’s gut sense of “this feels risky,” AI-assisted analysis can quantify how many systems, and how critical they are, depend on a proposed change — making the decision to renovate (or not) a more informed one.
The Metaphor, Fully Extended
| House Renovation Element | Data Modelling Concept |
|---|---|
| A load-bearing wall | A core field or relationship many systems depend on |
| Knocking down a load-bearing wall | A breaking schema change |
| Adding a new room | A non-breaking schema change (e.g., adding a new field) |
| A contractor’s blueprint review before demolition | Impact analysis before a schema change |
| X-ray vision to see pipes and wiring behind walls | AI-assisted lineage tracing |
| A temporary hallway kept open during renovation | Backward-compatible versioning during a transition |
| A surprise wall removal with no warning | An unannounced breaking change |
| A phased renovation plan, room by room | A staged schema migration |
| The renovation crew doing the physical labor | The engineering work of migrating data to a new structure |
| An AI-assisted structural engineer’s report | AI-generated impact and risk assessment for a proposed change |
For Beginners: What to Actually Do
- Before proposing any change to an existing table or field, get in the habit of asking “what currently depends on this?” — even if you don’t yet have a tool to answer it precisely.
- Learn to distinguish additive changes (new fields, new tables) from changes that remove or redefine something existing — the former is usually low-risk, the latter deserves real caution.
- If your organization has any kind of data lineage or impact-analysis tool, spend time actually using it before a change is urgent — understanding what it can and can’t see will save you in a crunch.
- Practice writing a short, plain-language description of any schema change you propose, aimed at someone non-technical — if you can’t explain what’s changing and why simply, you may not fully understand the impact yet either.
For Practitioners and Leaders: The Deeper Layer
- AI-assisted lineage tracing is most reliable when metadata and naming conventions are already reasonably consistent — invest in that foundation, since lineage tools trace what’s documented and inferable, not what’s tribal knowledge alone.
- Treat AI-generated migration logic and adapted downstream queries as a strong starting draft requiring validation, particularly for any change touching financial, regulatory, or AI-assistant-facing data — an automatically rewritten query that “looks right” can still subtly change business meaning.
- Use AI-assisted impact and risk scoring to build a more disciplined change-management process generally: not every change needs the same level of ceremony, and quantified risk helps a team apply caution where it’s actually warranted rather than uniformly everywhere.
- Backward-compatible versioning (keeping the “temporary hallway” open) remains a sound default even with better tooling — the goal of AI assistance here is making risk visible and migration faster, not removing the value of a careful, staged transition.
Quick Recap
- Schema evolution is changing a data model over time; versioning keeps that change from breaking systems built on the older structure.
- Breaking changes alter or remove something relied on; non-breaking changes simply add to what exists.
- Historically, uncertainty about downstream dependencies pushed teams toward either avoiding changes or making them disruptively all at once.
- AI-assisted lineage tracing now makes it possible to see, concretely, what a proposed change will affect before it happens.
- AI can help draft migration logic and assess risk, but validating that drafted logic preserves true business meaning still requires human review.
Where This Fits in the Series
Article 6 compared the broader philosophies of warehouse and lake storage; this article addressed what happens after a model is built — how to change it safely over time. Article 8, “An Apprentice Who Drafts While You Decide,” looks directly at AI-assisted and automated data modelling tools themselves, and where human judgment still belongs in the process.
Subscribe to the Newsletter
Get the latest DataParables articles delivered straight to your inbox.