Opening Scene
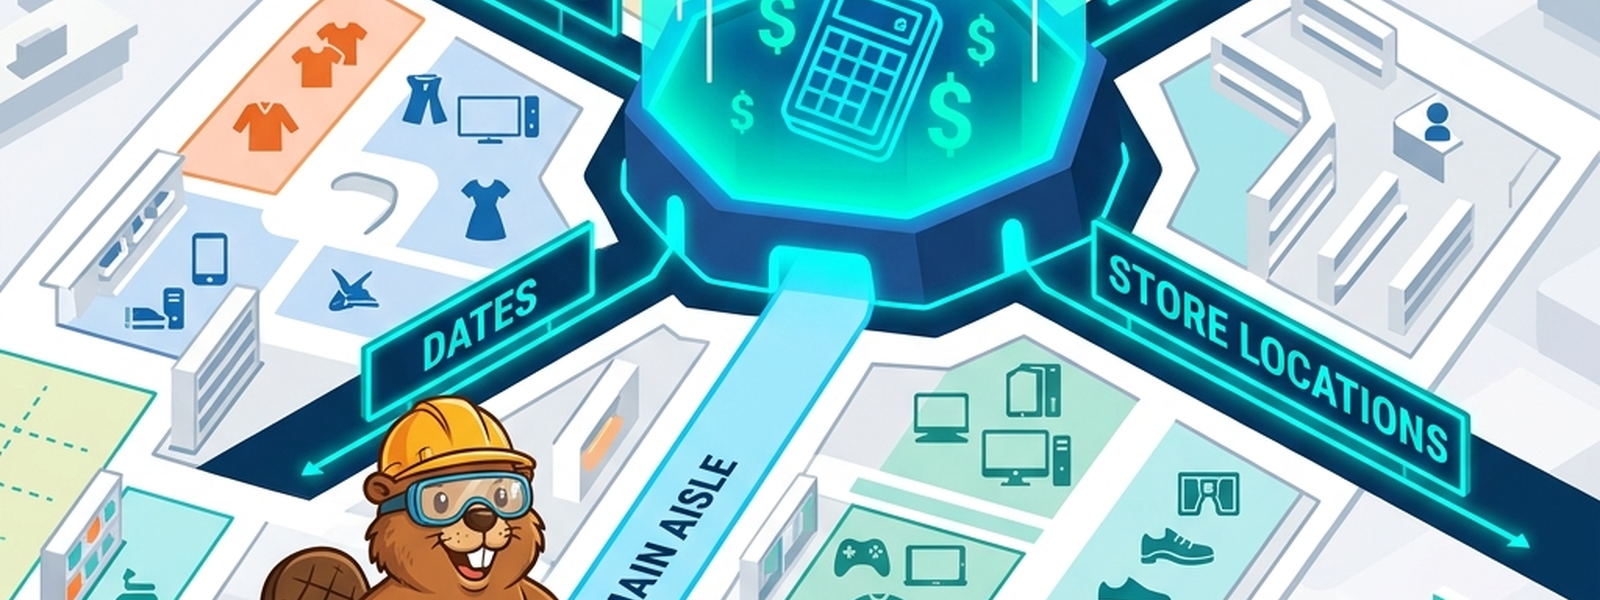
Walk into a well-designed department store and the layout makes sense without anyone explaining it: a central walkway runs through the middle, with shoe, electronics, and home goods sections branching off to the sides. You don’t need to know how the warehouse in the back is organized — you just need the floor plan to match the way you naturally think about shopping.
Analytics data needs the same kind of floor plan: organized not around how it was originally recorded, but around how people will actually ask questions of it.
In Plain English
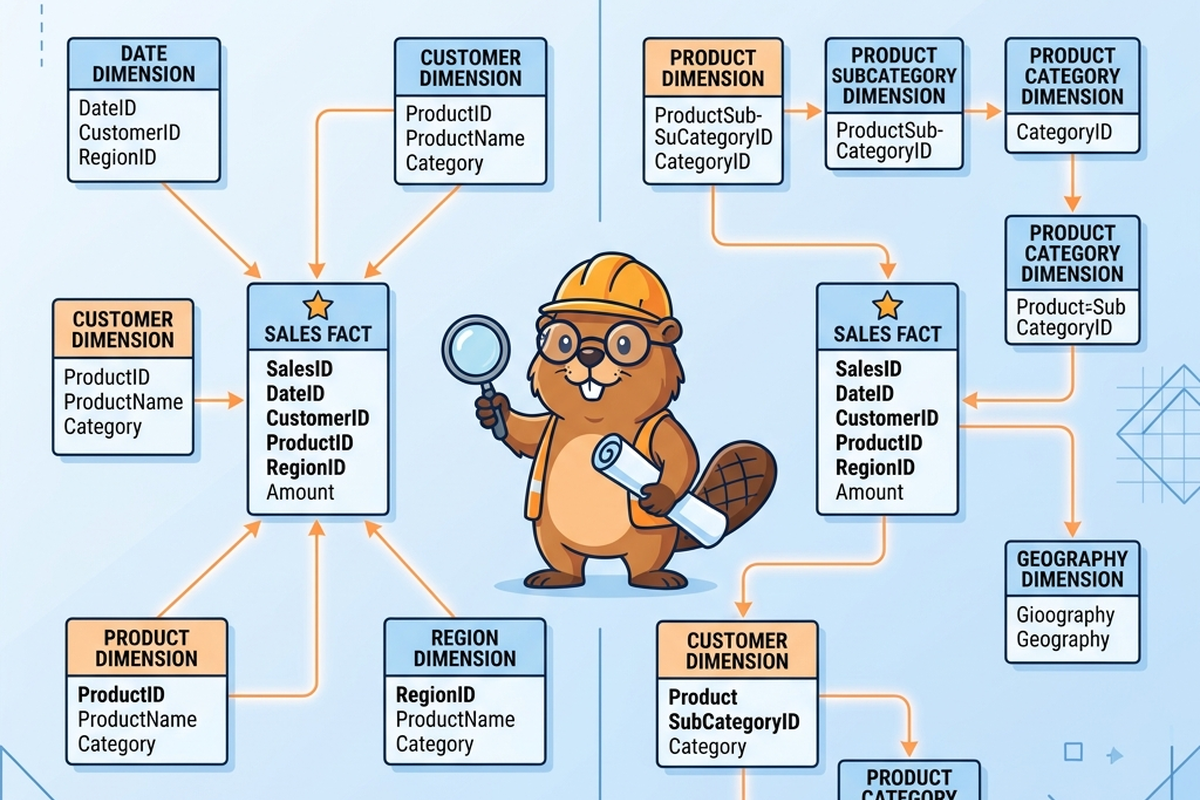
Dimensional modelling is a way of organizing data specifically for analysis and reporting, built around two kinds of tables: fact tables (the events or transactions you’re measuring, like sales) and dimension tables (the context around those events, like product, customer, or date). A star schema connects dimension tables directly to a central fact table, like store sections branching straight off a main aisle. A snowflake schema breaks dimensions down further into sub-tables, like a section that has its own smaller sub-sections.
The Old Way
Traditionally, building a dimensional model meant a data warehouse team carefully designing fact and dimension tables ahead of time, anticipating the kinds of questions the business would ask (“total sales by region by month,” “top products by customer segment”) and structuring the model to answer those efficiently. This was painstaking, upfront design work — like a store planner deciding exactly where the shoe section goes based on years of knowing how shoppers move through a store.
Once built, these models were relatively rigid. Adding a genuinely new way of slicing the data — a dimension nobody had anticipated — often meant a meaningful redesign effort, the equivalent of moving an entire section of the store floor rather than just rearranging shelves within it.
What’s Changing (and Why AI Is the Reason)
- AI assistants are now “walking the store” on the business’s behalf. As more people ask questions of their data through AI chat interfaces rather than browsing pre-built dashboards, the dimensional model has a new kind of visitor — one that needs the floor plan to be sensible and well-labeled just as much as a human does, perhaps more so, since it has no instinct to “just look around” when something’s unclear.
- Anticipating every question is becoming less necessary. AI-assisted query generation can often construct reasonable joins and aggregations across a reasonably well-structured model even for questions the original designers didn’t explicitly plan for, reducing (though not eliminating) the old pressure to predict every future business question at design time.
- Designing and validating the schema itself is getting AI assistance. Tools can now suggest candidate fact and dimension structures from raw transactional data, and flag likely modelling issues (such as a dimension that’s secretly changing over time without being tracked properly) faster than manual review used to catch them.
The Metaphor, Fully Extended
| Department Store Element | Dimensional Modelling Concept |
|---|---|
| The central main aisle | The fact table (transactions/events being measured) |
| A themed section (shoes, electronics, home goods) | A dimension table (context: product, customer, date) |
| A section connected directly off the main aisle | A star schema (dimensions linked directly to the fact table) |
| A section with smaller sub-sections inside it | A snowflake schema (dimensions broken into further sub-tables) |
| The total receipts collected at checkout | A measure (e.g., total sales amount) |
| A store map sign at the entrance | Schema documentation / data dictionary |
| A store planner deciding the layout in advance | A data architect designing the dimensional model |
| A shopper browsing the floor on their own | A human analyst running a manual query or report |
| A personal shopping assistant guiding a customer through the store | An AI assistant generating queries against the model on a user’s behalf |
| Renovating a section because shopping habits changed | Redesigning a dimension to support a newly important business question |
For Beginners: What to Actually Do
- Practice telling the difference between a fact (something you’re measuring, usually a number — sales amount, quantity) and a dimension (context you’d use to slice that number — by date, by region, by product).
- Try sketching a star schema for something familiar, like a coffee shop’s sales: what’s the fact table, and what dimensions would you want to slice it by?
- When exploring a dimensional model for the first time, start by identifying the fact table — it’s usually the busiest, most frequently updated table, and everything else tends to orbit around it.
- If you’re using an AI assistant to query a dimensional model, check that the dimensions it used in its answer actually match the ones you intended — it’s easy for a vaguely worded question to get matched to the wrong “section of the store.”
For Practitioners and Leaders: The Deeper Layer
- As AI query assistants become a primary way business users interact with the model, invest in clear, consistent naming and documentation at the schema level — an AI assistant’s accuracy is bounded by how well-labeled the “store sections” actually are, just as a human shopper’s experience is.
- Slowly changing dimensions (where a dimension’s attributes change over time, like a customer’s address) remain one of the trickier modelling problems dimensional modelling has always had — AI-assisted detection can flag where this is happening in your data, but the decision of how to handle it (tracking history vs. overwriting) is still a deliberate business call.
- AI’s ability to generate reasonable queries against unanticipated question types reduces, but doesn’t eliminate, the value of deliberate dimensional design — a well-designed star schema still produces faster, more reliable answers than asking any tool to assemble ad hoc joins against a poorly structured model.
- Snowflake schemas trade some query simplicity for storage efficiency and easier dimension maintenance; this trade-off is unchanged by AI assistance, and remains a deliberate design decision rather than a default.
Quick Recap
- Dimensional modelling organizes data into fact tables (what’s being measured) and dimension tables (context for slicing it), designed around how people ask questions.
- A star schema connects dimensions directly to a fact table; a snowflake schema breaks dimensions into further sub-tables.
- Traditionally, this required carefully anticipating future business questions at design time.
- AI query assistants are now a meaningful “visitor” to these models, making clear structure and labeling more important, not less.
- AI assistance reduces, but doesn’t remove, the value of deliberate, well-planned dimensional design.
Where This Fits in the Series
Article 4 focused on reducing duplication in operational data through normalization; this article looked at the deliberately different structure used for analytics — dimensional modelling, optimized for questions rather than transactions. Article 6, “The Library and the Storage Unit,” zooms out further to compare how data is modelled for structured warehouses versus more flexible data lakes.
Subscribe to the Newsletter
Get the latest DataParables articles delivered straight to your inbox.