
Opening Scene
At a big family reunion, someone inevitably ends up explaining the family tree to a confused cousin’s new partner: “She’s my mother’s sister, so that makes her my aunt, and her kids are my cousins.” There’s a structure here — parents have children, siblings share parents, marriages connect separate branches — and once you see the structure, every relationship in the room makes sense at a glance.
Data has the same kind of structure hiding underneath it, and giving it a name is most of the work of entity-relationship modelling.
In Plain English
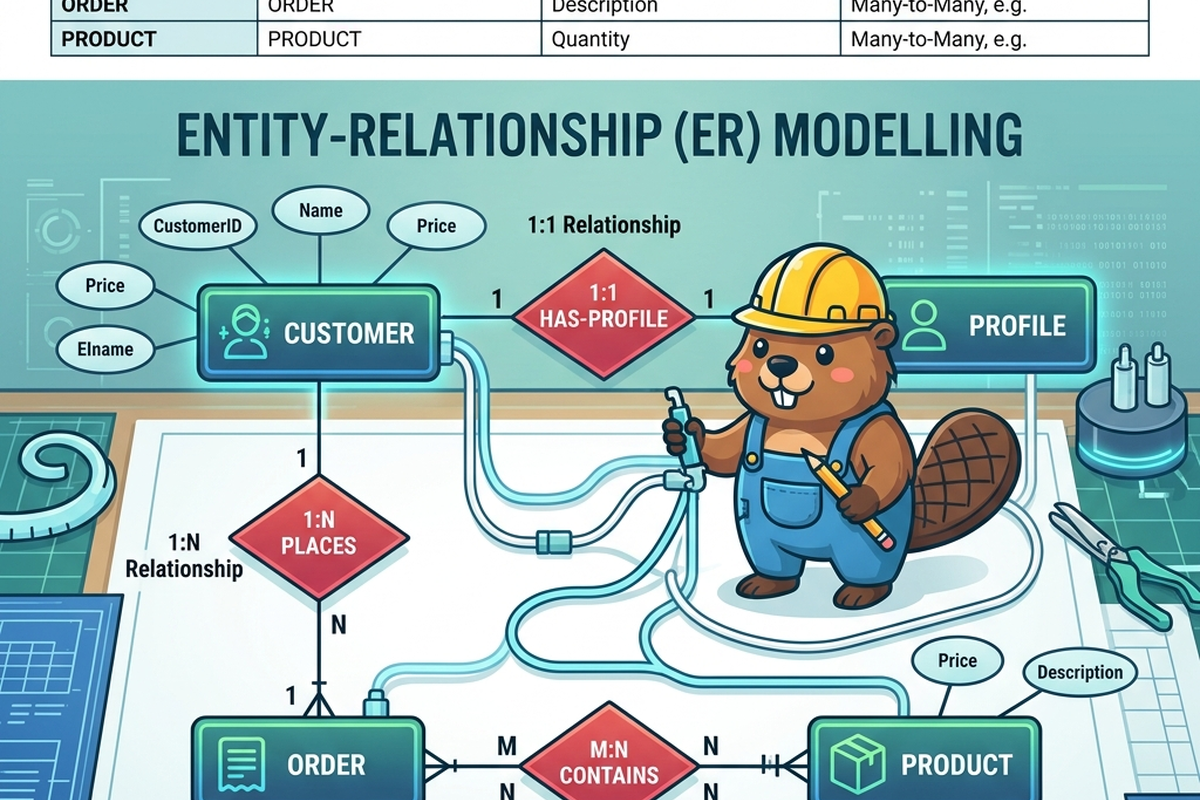
Entity-relationship modelling is the practice of identifying the distinct “things” in your data (entities, like “Customer” or “Order”), the facts you want to track about each one (attributes, like “name” or “order date”), and exactly how those things connect to each other (relationships, like “a customer can place many orders”). Getting the relationships right — including how many of one thing can connect to how many of another — is often the trickiest and most important part.
The Old Way
Traditionally, mapping these relationships out was a slow, manual, interview-heavy process. A data architect would sit with business stakeholders and ask family-tree-style questions: “Can one customer have multiple orders? Can one order have multiple customers? Can a product appear on more than one order?” Each answer determined whether the relationship was one-to-one, one-to-many, or many-to-many — and getting it wrong meant the resulting database would either lose information or force awkward workarounds later.
This process worked, but it was entirely dependent on the architect asking the right questions and the stakeholders giving precise, consistent answers. Subtle relationships — the data equivalent of a “second cousin once removed” — were easy to miss entirely, especially in large, unfamiliar systems with hundreds of existing tables and no one left who remembered why they were built that way.
What’s Changing (and Why AI Is the Reason)
- AI can infer relationships from existing data, not just from interviews. Given a set of tables or files, AI tools can now scan actual values and usage patterns to suggest “these two tables look related, probably through this column” — effectively doing genealogical detective work, inferring family lines from scattered birth and marriage records instead of asking everyone directly.
- Cardinality checking is becoming automatic. Rather than relying purely on a stakeholder’s verbal answer, AI-assisted tools can examine real data to confirm whether a relationship is genuinely one-to-many or many-to-many — catching cases where the business believes a rule holds but the actual data quietly violates it.
- Legacy systems are becoming explainable again. Large, undocumented systems built up over decades — the data equivalent of a family tree with lost records — are increasingly approachable with AI assistance, which can propose a plausible relationship map from the data itself, giving teams a starting point where previously there was only tribal memory or nothing at all.
The Metaphor, Fully Extended
| Family Tree Element | Data Modelling Concept |
|---|---|
| A person on the family tree | An entity (e.g., “Customer,” “Order”) |
| A fact about a person (birthdate, name) | An attribute |
| A parent-child connection | A one-to-many relationship |
| A sibling connection (shared parents) | A many-to-many relationship |
| A marriage connecting two branches | A relationship linking two previously separate entities |
| A unique ID on a birth certificate | A primary key |
| A reference to “child of” on a record | A foreign key |
| A genealogist interviewing relatives | A data architect interviewing business stakeholders |
| A genealogist inferring links from old scattered records | AI inferring relationships from existing data patterns |
| Discovering a forgotten branch of the family | Uncovering an undocumented relationship in a legacy system |
For Beginners: What to Actually Do
- Practice asking the three family-tree-style cardinality questions out loud for any two things you’re modelling: “Can one of these have many of those? Can one of those have many of these? Can it go both ways?”
- Get comfortable with the difference between a primary key (what makes a record unique) and a foreign key (a pointer to a related record) — draw it out as literal arrows if it helps.
- When using an AI tool to suggest relationships from sample data, double-check at least a few suggestions manually against real records before trusting the rest.
- Try mapping a relationship you already understand well in real life (e.g., a library’s books and authors) to entities, attributes, and relationship types as practice.
For Practitioners and Leaders: The Deeper Layer
- AI-inferred relationships from existing data are a strong way to bootstrap understanding of legacy or undocumented systems, but they reflect what the data does show, not necessarily what it should show — distinguish between “this relationship exists in the data” and “this relationship is the intended business rule” before codifying it.
- Cardinality violations that AI tools surface (a relationship believed to be one-to-many that actually has many-to-many cases hiding in the data) are often signals of real data quality issues upstream — treat these findings as a starting point for investigation, not just a modelling correction.
- Be cautious about leaning entirely on AI-inferred relationship maps for systems with regulatory or financial significance; an inferred relationship based on incomplete or biased sample data can quietly encode the wrong assumption into a model that downstream AI tools will later treat as ground truth.
- Many-to-many relationships are still the most common source of subtle business logic errors in mature systems — this hasn’t changed with AI assistance, and is worth continuing to review manually even when tooling proposes a confident answer.
Quick Recap
- Entity-relationship modelling identifies the “things” in your data (entities), facts about them (attributes), and how they connect (relationships).
- Getting relationship cardinality right — one-to-one, one-to-many, many-to-many — is often the trickiest and most consequential part of the process.
- Traditionally, this required careful, interview-driven discovery, especially for undocumented legacy systems.
- AI can now infer likely relationships directly from existing data, acting like a genealogist working from scattered records rather than direct interviews.
- AI-suggested relationships should be verified against real business intent, not accepted purely because they match patterns in the data.
Where This Fits in the Series
Article 2 walked through the three drafts every data model passes through; this article zoomed into the relationships that get defined at the logical layer. Article 4, “A Pantry That Makes Sense,” moves into normalization — how to organize a model so the same fact isn’t duplicated and contradicted across multiple places.
Subscribe to the Newsletter
Get the latest DataParables articles delivered straight to your inbox.