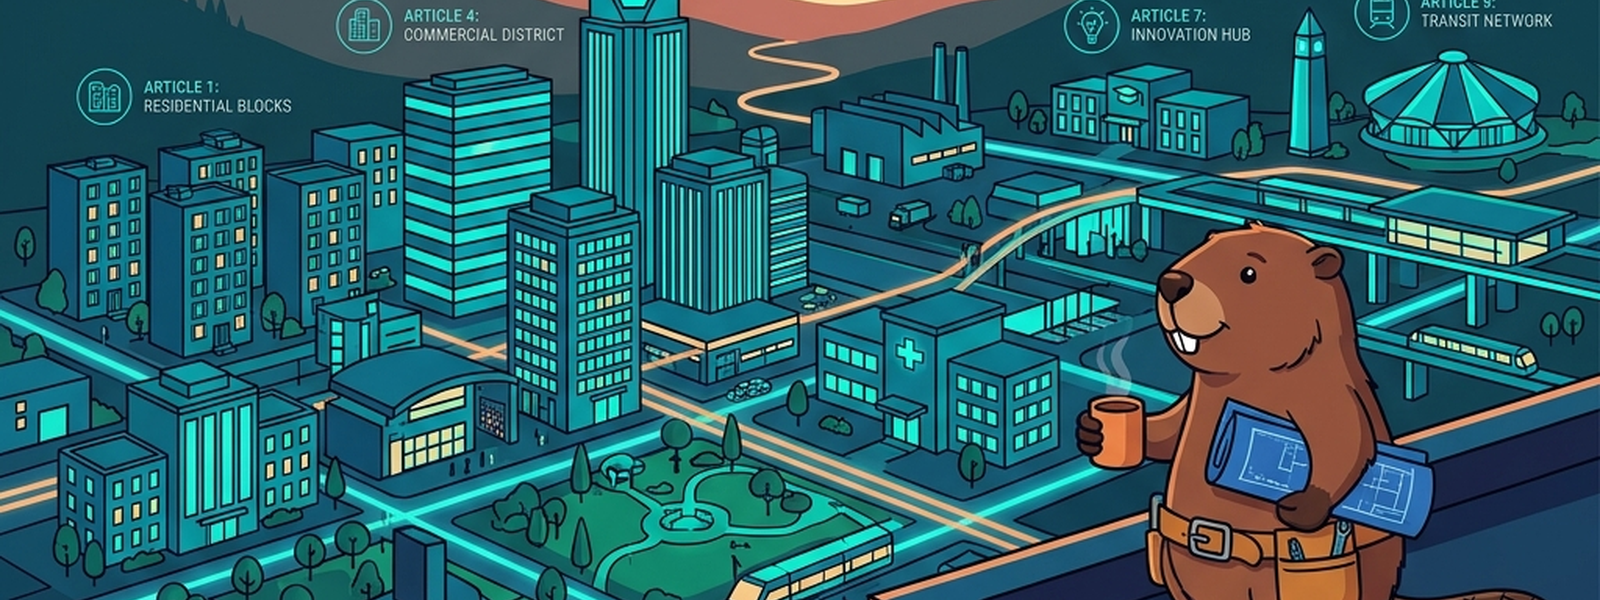
Opening Scene
Stand on a rooftop at dusk and look out over a finished city. The skyline that started as a single rolled-up blueprint in Article 1 has become something real: a pantry-organized grocery district, a department-store-style shopping strip, a library and a storage-unit warehouse district side by side, a few buildings mid-renovation, and streets lit with the soft glow of a tour guide’s annotated map showing visitors — human and otherwise — what everything actually means. Every neighborhood started as someone’s careful drawing. None of it would exist without the blueprint that came first.
In Plain English
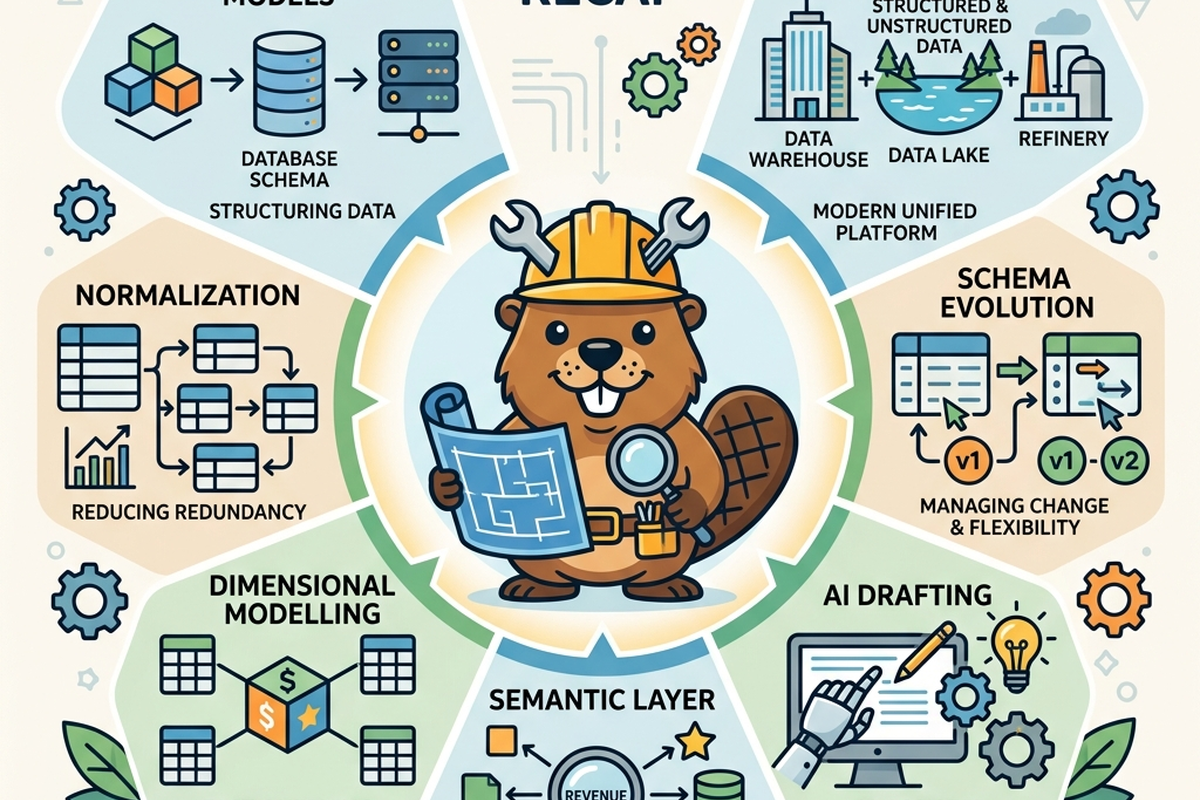
This final article doesn’t introduce a new concept — it’s a deliberate walk back through everything the series has covered, reassembled as one connected whole. The point is simple: every piece of good data modelling, from the simplest entity to the most sophisticated knowledge graph, exists to make data trustworthy and understandable — for the humans who’ve always depended on it, and increasingly, for the AI tools now standing right alongside them.
The Old Way
The “old way,” across this entire series, was consistent: careful, deliberate, often slow human craftsmanship, built up over decades of hard-won practice — conceptual sketches refined into logical blueprints, normalized pantries keeping facts honest, dimensional store floors designed around real questions, warehouses and lakes each solving a different storage problem, renovations handled with real caution, and meaning carried mostly in people’s heads or scattered documentation.
None of that craftsmanship has become obsolete. Every “new way” covered in this series was built on top of it, not instead of it — the apprentice in Article 8 still needs a senior architect; the AI-inferred relationships in Article 3 still need a human checking them against real business intent. The throughline across all ten articles has been augmentation, not replacement.
What’s Changing (and Why AI Is the Reason): The Series, Recapped
- Drafting got faster, everywhere. From conceptual sketches (Article 2) to relationship discovery (Article 3) to full first-draft models (Article 8), AI has consistently compressed the slowest, most repetitive parts of modelling work, leaving more time for the judgment-heavy parts that still need a human.
- Maintenance got more honest. Detecting duplication (Article 4), tracing change impact (Article 7), and flagging inconsistent metric definitions (Article 9) were all, historically, things that quietly slipped under deadline pressure. AI-assisted detection has made ongoing model hygiene a tooling problem instead of purely a discipline problem.
- The model gained a second audience. Across nearly every article, one thread kept resurfacing: AI tools — copilots, chat assistants, automated query generators — are now reading and relying on these models directly. A model that’s merely “good enough for a human who can ask a colleague when confused” is no longer good enough; it needs to be clear enough for a tool with no instinct to ask follow-up questions.
The Metaphor, Fully Extended: The City Map
| City District | Series Article & Core Lesson |
|---|---|
| The city’s original blueprint | Article 1 — Data modelling as the foundational plan beneath everything else |
| The architect’s drafting studio | Article 2 — Conceptual, logical, and physical models, three drafts of the same design |
| The residential family-tree neighborhood | Article 3 — Entity-relationship modelling and how relationships are discovered |
| The pantry-organized grocery district | Article 4 — Normalization and denormalization, keeping facts honest |
| The department store shopping strip | Article 5 — Dimensional modelling, designed around real questions |
| The library and storage-unit warehouse district | Article 6 — Warehouses, lakes, and lakehouses, two philosophies of storage |
| The block under renovation | Article 7 — Schema evolution and versioning, changing safely over time |
| The architect’s studio, apprentice included | Article 8 — AI-assisted modelling tools and where human judgment still belongs |
| The tour-guided streets with annotated landmarks | Article 9 — Semantic layers and knowledge graphs, shared meaning at scale |
| The whole city, viewed from above | Article 10 — Every piece, reassembled as one connected, AI-ready whole |
For Beginners: What to Actually Do
- If you’re new to this space, treat this series as a rough order of skill-building: understand entities and relationships (Article 3) and normalization (Article 4) solidly before leaning heavily on AI-assisted drafting tools — you need to be able to evaluate a draft, not just receive one.
- Revisit any article in this series that covered a concept you use regularly at work, and try re-explaining its metaphor to a colleague without technical jargon — that’s a genuine test of whether you’ve actually internalized it.
- Get comfortable being the person who asks “what does this AI-generated model assume that it shouldn’t?” — that question, more than any specific tool skill, is what will make you valuable as these tools keep improving.
- Don’t treat “AI can do this now” as a reason to skip learning the fundamentals — every article in this series showed AI accelerating a process that still fundamentally depends on someone understanding what’s actually happening underneath.
For Practitioners and Leaders: The Deeper Layer
- Step back and audit your own team against this series’ throughline: where has drafting sped up but review discipline failed to keep pace? That gap — fast AI output, unchanged human review capacity — is where avoidable mistakes are most likely to surface.
- The recurring theme of “the model now has a second audience” (AI copilots and assistants) deserves a deliberate response, not an assumed one: decide explicitly whether your semantic layer, naming conventions, and documentation are actually ready for a tool with no instinct to double-check ambiguity.
- Consider where your organization still treats data modelling as a one-time, front-loaded project rather than an ongoing discipline — several articles in this series (4, 7, 9 especially) pointed at AI making continuous maintenance more realistic than it used to be, which changes the calculus on whether “set it and forget it” modelling is still a reasonable default.
- As AI-assisted modelling tools keep maturing, the most durable skill for a data professional isn’t memorizing a tool’s current capabilities — it’s the judgment to know what any tool, AI or otherwise, can’t yet see about your business. That judgment is what every article in this series, in different language, has ultimately been about.
Quick Recap
- This series treated data modelling as a city’s blueprint — the unglamorous foundation beneath every dashboard, report, and AI assistant.
- Across ten articles, AI consistently accelerated drafting and maintenance, but never replaced the human judgment needed to evaluate context, intent, and consequence.
- A clear throughline: AI tools are now a direct audience for data models, raising the stakes of getting structure and meaning right, not lowering them.
- The skills covered — entities and relationships, normalization, dimensional design, warehouse vs. lake thinking, safe schema evolution, AI-assisted drafting, and semantic layers — combine into one connected discipline, not ten separate ones.
- The most durable skill going forward is judgment: knowing what an AI tool’s draft doesn’t yet know about your business.
Where This Fits in the Series
This article closes the series’ first arc, reassembling every article’s metaphor as a neighborhood of one finished city, and looking ahead to where data modelling is headed next as AI reshapes the discipline. If you’re returning to this series later, Article 1’s rolled-up blueprint is the natural starting point for anyone new to the series, and this article is the natural one to revisit whenever you need the first arc’s whole picture at once. The series continues in Article 11, going deeper into schema evolution and versioning — the safe-renovation theme first introduced in Article 7 — closing with a second, final capstone in Article 20.
Subscribe to the Newsletter
Get the latest DataParables articles delivered straight to your inbox.