
Opening Scene
Back in Article 1, we left a small one-road town in the middle of becoming a city. Over the last nine articles, we’ve actually walked through that city, district by district: a library learning to serve a new kind of patron, a kitchen kitchen welcoming a sous-chef, an airport rebuilding its safety systems around a control tower, a hotel adding a concierge who actually knows the building, an emergency dispatch center reacting in real time, an orchestra learning to play with a conductor, a household rethinking its utility bill, and a sports team redrawing its lineup.
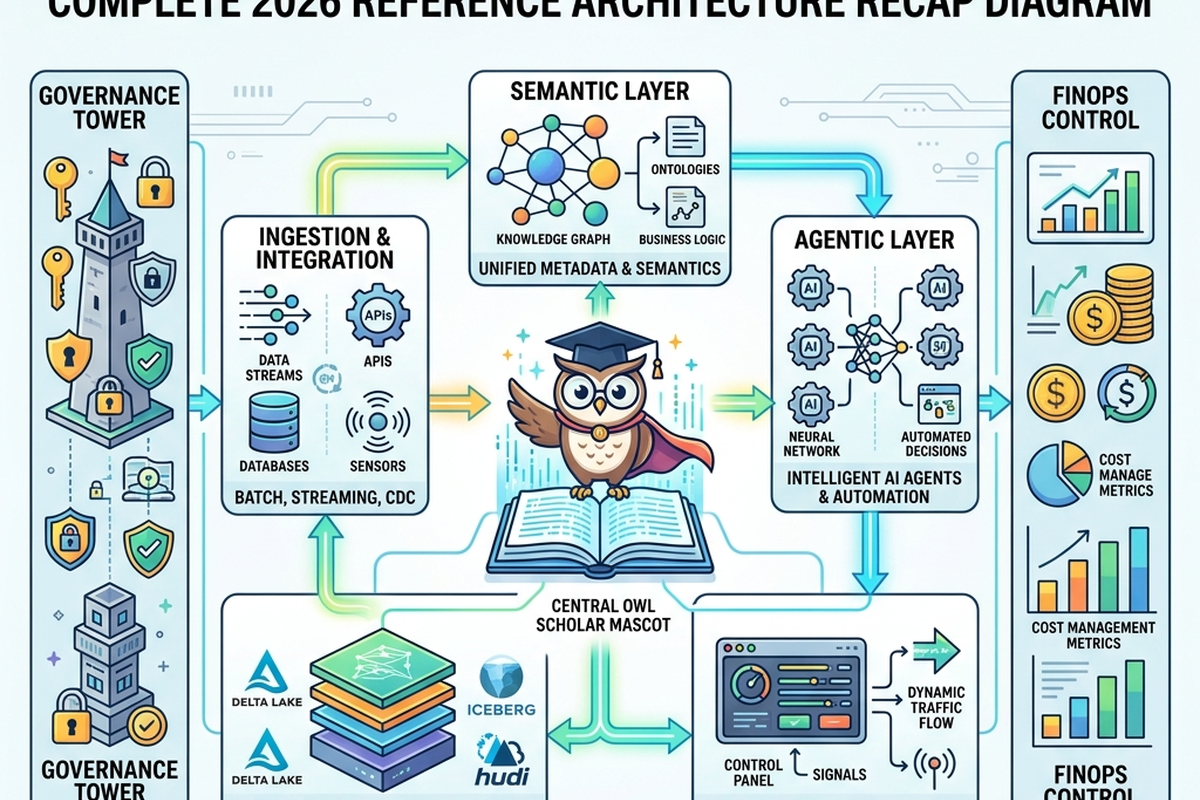
It’s time to stand back and look at the whole map at once — not as separate metaphors anymore, but as one connected city, with one blueprint. That blueprint is what architects call a reference architecture: not a literal plan for your specific organization, but a shared shape that most AI-native analytics environments are converging toward, so you have something concrete to compare your own city against.
In Plain English
A reference architecture is a generalized blueprint — not “build exactly this,” but “here’s the shape that tends to work, and here’s where the important pieces usually go.” Think of it like a standard city-planning template: not every city needs the exact same buildings, but most well-functioning cities have some version of a water system, a road network, an emergency response system, and zoning rules — in roughly the same relationships to each other.
This article lays out that blueprint for AI-native analytics, using the districts from the rest of the series, and gives you a checklist to compare against your own.
The Old Way
The traditional reference architecture for analytics was the one-road-town diagram from Article 1: source, ingestion, warehouse, transformation, BI, human. It was a real, useful blueprint — for a city that only ever needed one road. It assumed:
- One direction of data flow, ending at a dashboard.
- One kind of “citizen” using the city: a human analyst.
- One checkpoint for trust, near the end of the journey.
- A fixed lineup of tools, with humans doing all the connecting work between them.
For years, that blueprint was genuinely sufficient. It’s not that it was wrong — it’s that the city it described doesn’t match the city most organizations are actually building anymore.
What’s Changing (and Why AI Is the Reason)
Pulling together everything from this series, the new blueprint has five core districts, each one a direct callback to an earlier article:
1. The Fabric (Article 1) — the road network. Instead of one road from source to dashboard, a connected mesh where data, agents, and people can move in multiple directions — not just upward to a single destination.
2. The Semantic Layer (Article 2) — the street signs and the city catalog. A precise, well-documented, machine-readable map of what everything in the city actually means, built for both human and AI “citizens” to navigate without needing to ask a local for directions.
3. The Augmentation & Orchestration Layer (Articles 3, 6, 7) — the kitchen’s sous-chef, the dispatch center, and the conductor, working together. The parts of the city where AI actively does work: enriching data mid-pipeline, making real-time decisions on streaming events, and coordinating which specialized tool gets called when — all woven through the fabric rather than sitting in one box.
4. The Trust Layer (Article 4) — the control tower and the flight recorder. Continuous, distributed governance: lineage tracking, proportional oversight, and human-in-the-loop checkpoints placed where the stakes are highest, not just at one gate near the end.
5. The Consumption Layer (Article 5) — the concierge desk, still standing next to the old lobby map. Where people actually get their answers: a mix of traditional dashboards for known, recurring questions, and conversational/agentic interfaces for novel, specific ones — both grounded in the same semantic layer underneath.
Running underneath and across all five districts are two things from Articles 8 and 9 that don’t get their own box on the map, because they touch everything: a cost and context budget (the utility bill the whole city shares), and a people and org design (the city’s workforce, redeployed and re-skilled around the new districts, not left to figure it out room by room).
The Metaphor, Fully Extended
| The City, Fully Built (Metaphor) | The Reference Architecture (Technical) |
|---|---|
| The old one-road town | The traditional linear data stack (source → warehouse → BI → human) |
| The connected road network | The analytics fabric — multi-directional data and agent movement (Article 1) |
| Street signs and the city catalog | The semantic layer — a machine-and-human-readable map of meaning (Article 2) |
| The sous-chef, the dispatch center, the conductor | The augmentation and orchestration layer — AI doing real work throughout the pipeline (Articles 3, 6, 7) |
| The control tower and flight recorder | The trust/governance layer — continuous lineage and proportional oversight (Article 4) |
| The concierge desk beside the old lobby map | The consumption layer — dashboards and conversational interfaces, both grounded in the semantic layer (Article 5) |
| The shared utility bill for the whole city | The cost and context budget spanning every district (Article 8) |
| The city’s workforce, redeployed across new and old roles | The people and org design supporting the whole architecture (Article 9) |
| A city planner’s master blueprint, compared against the actual city as built | A reference architecture, used as a benchmark against your organization’s real environment |
For Beginners: What to Actually Do
- Use this five-district map as a mental checklist whenever you join a new team or project. Ask: where’s our semantic layer? Where does augmentation happen? Who handles oversight? Even if you don’t own any of these, knowing the map makes you a far more effective contributor to conversations about it.
- Don’t expect your organization to have all five districts built out fully — almost none do yet. This is a direction, not a pass/fail test. Knowing which districts are missing or underdeveloped where you work is genuinely valuable, grounded insight, not a criticism.
- Revisit the earlier articles in this series as your “neighborhood guides.” Each one goes deep on one district; this final piece is meant to be the map that shows how they all connect, not a replacement for the detail in each one.
For Practitioners and Leaders: The Deeper Layer — A Self-Assessment Checklist
Use this checklist to gauge how “AI-native” your current analytics architecture actually is. For each district, ask honestly where you stand:
- Fabric: Can AI agents and tools access data directly through well-defined paths, or does everything still have to flow through one central dashboard-shaped bottleneck?
- Semantic Layer: If an AI agent queried your data directly today, would it get clear, well-defined answers — or would it inherit the same ambiguity a confused new analyst would?
- Augmentation & Orchestration: Is AI-driven enrichment and decision-making happening at deliberate, well-instrumented points in your pipelines and real-time systems — or scattered ad hoc, with little visibility into where and how often it’s called?
- Trust Layer: If something an AI-augmented system did turned out to be wrong, could you trace exactly what happened, when, and why — or would you be reconstructing it from memory and guesswork?
- Consumption Layer: Do your conversational or agentic BI tools sit on top of a governed semantic layer, or are they generating answers ungrounded in any defined, trustworthy source?
- Cost & Context: Do you actually track AI inference cost as a visible metric, with clear decisions about where AI should and shouldn’t be used — or is it an unmonitored, growing line item?
- People & Org: Have roles and responsibilities been deliberately redesigned around AI-augmented work — reviewer roles, semantic layer ownership, cost ownership — or has adoption happened informally, team by team, with no shared strategy?
Honest “not yet” answers aren’t a failure — they’re simply where your roadmap starts. Very few organizations would score well across all seven right now. That’s the actual state of the field in 2026, not a sign you’re behind some invisible curve everyone else has already cleared.
Quick Recap
- The old reference architecture was a one-road town: linear, single-destination, single-audience.
- The new reference architecture is a five-district city: the fabric, the semantic layer, the augmentation/orchestration layer, the trust layer, and the consumption layer — with cost and people considerations running underneath all of them.
- This is a direction to grow toward, not a checklist to complete overnight — most organizations are still building out several districts.
- Use the self-assessment checklist periodically, the way a city planner would re-survey a growing city, not as a one-time audit.
- Every metaphor from this series — the library, the kitchen, the airport, the hotel, the dispatch center, the orchestra, the household, the sports team — is a district in the same city. None of them stand alone, and neither should the parts of your architecture they represent.
Where This Fits in the Series
This article is the map that ties together everything explored across Articles 1 through 9 — the fabric, the data model, the pipeline, governance, consumption, real-time decisions, orchestration, cost, and people. If you’re returning to this series later, this is the article to start from for the big picture, and to branch outward into whichever district needs the closest attention in your own organization right now.
End of series: “Analytics Design & Architecture in the AI Era.” Ten articles, one connected city, one recurring guide. Thank you for walking through it.
Subscribe to the Newsletter
Get the latest DataParables articles delivered straight to your inbox.